
October 30, 2024
The Data Lineage Apache Flink Really Needs: Debugging Policy Violations
Last week at Flink Forward, together with Colten Pilgreen, I had the pleasure of presenting Datorios’ data lineage


Observability, Troubleshooting, & Job Insights are some of the things that drive the team at Datorios everyday. From the beginning they’ve sought out to bring a better experience when trying to understand the inner workings of Flink pipelines, and with their latest release, why should PyFlink be any different? If you said it shouldn’t be any different, then you’ve come to the right place!

The ability to use PyFlink opens many doors to you, your team, and especially to the Data Scientists and Analysts who already know and love Python. PyFlink allows you to bring in a bigger base of users to help build Flink pipelines and Python already has a whole host of packages to help aid in processing data. So why wouldn’t you want to get started with PyFlink?
Before we get started, we’ll need to make sure we’re using the latest version of Datorios so that it supports the use of PyFlink when analyzing your jobs!
For this article we’re just going to be writing a simple PyFlink pipeline, but don’t let this limit your imagination! You can refer to the PyFlink documentation to learn more about PyFlink and all of the things it is capable of doing (spoiler, it’s a lot).
The PyFlink pipeline that we will be writing today will be a simple windowing pipeline to create metrics for the messages sent between users. We will start with by writing a collection, then watermarking our messages, then windowing them into 5 second windows, where we will count the number of messages a user sent in the window, then print the results out to standard out. Let’s get started!
To get started, we need to set up the environment to tell Flink how we want to process this pipeline in Python. We’ll be using the StreamExecutionEnvironment in Streaming mode.
from pyflink.common import WatermarkStrategy, Duration, Time
from pyflink.common.watermark_strategy import TimestampAssigner
from pyflink.datastream import StreamExecutionEnvironment, RuntimeExecutionMode
from pyflink.datastream.window import TumblingEventTimeWindows

# Create the StreamExecutionEnvironment in Streaming Mode
env = StreamExecutionEnvironment.get_execution_environment()
env.set_runtime_mode(RuntimeExecutionMode.STREAMING)Now that we’ve gotten the StreamExecutionEnvironment set up, we need to have some sort of data to actually process against. Thankfully we can create a DataStream from a collection just the same as you can in the Java APIs.
The DataStream we will be creating will be a tuple of 4 elements: id, message, username, and timestamp. The DataStream represents messages sent back and forth between users in a messaging system. The DataStream is created using the from_collection method on the StreamExecutionEnvironment we created earlier.
# Create a DataStream from a collection of Tuples
messages = env.from_collection(
    [
        (1, 'Hi', 'Colten', 1716378540000),
        (2, 'Hello', 'Alex', 1716378541000),
        (3, 'How are you?', 'Colten', 1716378542000),
        (4, 'Good, what is your name?', 'Alex', 1716378544000),
        (5, 'Colten, who are you?', 'Colten', 1716378546000),
        (6, 'Alex, nice to meet you!', 'Alex', 1716378548000),
        (7, 'Likewise.', 'Colten', 1716378549000)
    ]
)Now that we’ve gotten some data to process, we’ll need to watermark the records using the timestamp element in the message tuple. If you are already familiar with the Java API this will look very similar, we must supply a WatermarkStrategy to apply to the DataStream and create a TimestampAssigner to choose which element in the tuple to use for the watermark.
# The TimestampAssigner to pull the timestamp element out of the tuple
class UserMessageTimestampAssigner(TimestampAssigner):
    def extract_timestamp(self, message, record_timestamp):
        return message[3]

# Apply a BoundedOutOfOrderness of 0 WatermarkStrategy to the
# messages stream, and then supply our UserMessageTimestampAsssigner
watermarked_messages = (
    messages
    .assign_timestamps_and_watermarks(
        WatermarkStrategy
        .for_bounded_out_of_orderness(Duration.of_seconds(5))
        .with_timestamp_assigner(UserMessageTimestampAssigner())
    )
)Now that we’ve gotten our Messages watermarked, we can now convert our messages tuple into something that can be aggregated inside of a reduce function, then key by the username tied to the message, then apply a TumblingEventTime window to the stream, then reduce the metrics to a singular window output!
# Convert our message tuple into a new tuple to reduce (username, count)
unaggregated_metrics = (
    watermarked_messages
    .map(lambda message: (message[2], 1))
)

# Window the unaggregated metrics and then reduce them
message_metrics = (
    unaggregated_metrics
    .key_by(lambda metric: metric[0])
    .window(TumblingEventTimeWindows.of(Time.seconds(5)))
    .reduce(lambda a, b: (a[0], a[1] + b[1]))
)

# Send out MessageMetrics to stdout, then execute the pipeline
message_metrics.print()
env.execute('UserMessageMetrics')
Congrats! You’ve just written your first PyFlink pipeline, you can see the full file with all of the snippets put together in my flink-snippets repo. Now we can get started with running this PyFlink pipeline in the Datorios cluster so we can see what’s going on inside of the job.
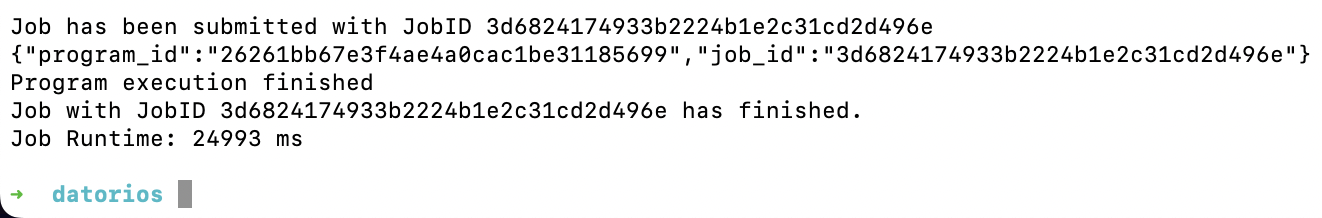
The great thing about PyFlink is that we do not need to compile our pipeline into a jar, we can simply submit the job to the cluster and then the Flink engine will do all of the work for us. So let’s get started!
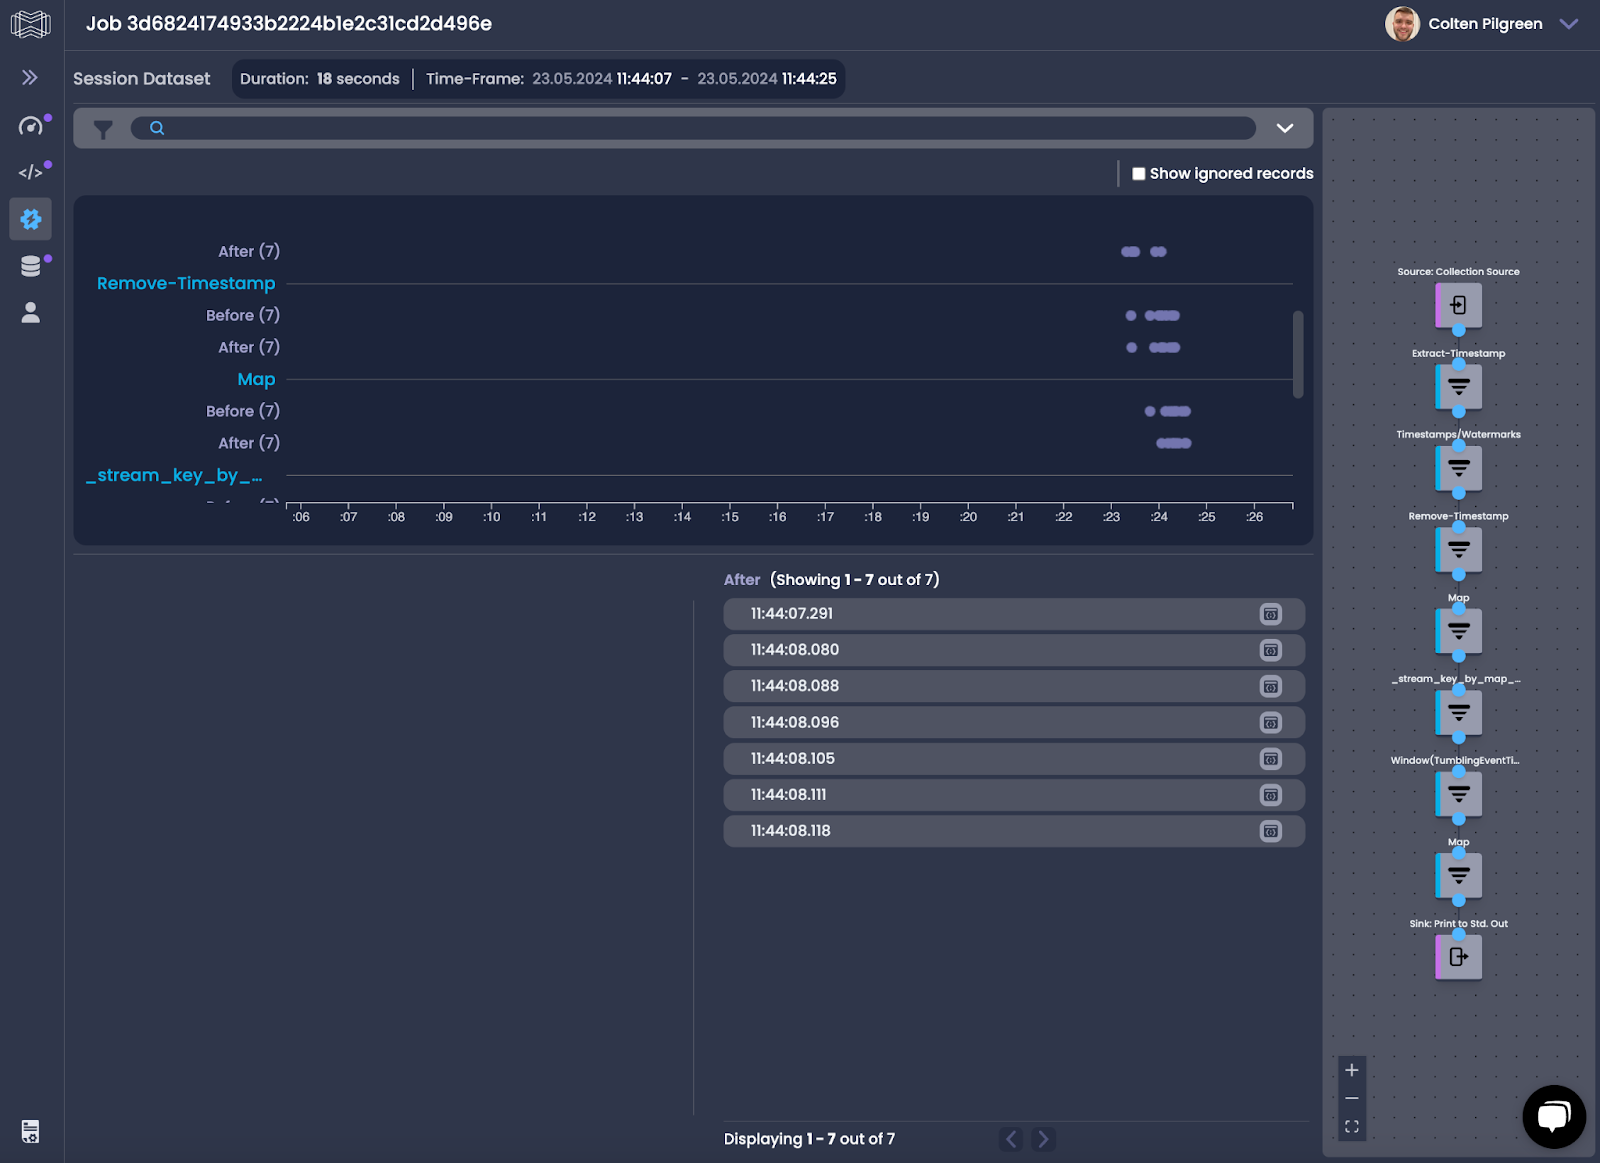
Now that we’ve seen the power of PyFlink, we can now dive into how you can use the Datorios UI that we all know and love. You’ll notice that we get the same view that we’re used to with Java Flink, but specifically tailored for this PyFlink pipeline.
We can see our Job Graph over on the right along with the Timeline of events flowing through it. You’ll notice that this PyFlink pipeline has a few more operators than we’d expect to see in a Java API pipeline, that is because under the hood PyFlink runs on the Java Environment and in between operators there is a translation between the Java and Python Beam runtime that runs our Python Code. Pretty neat right?
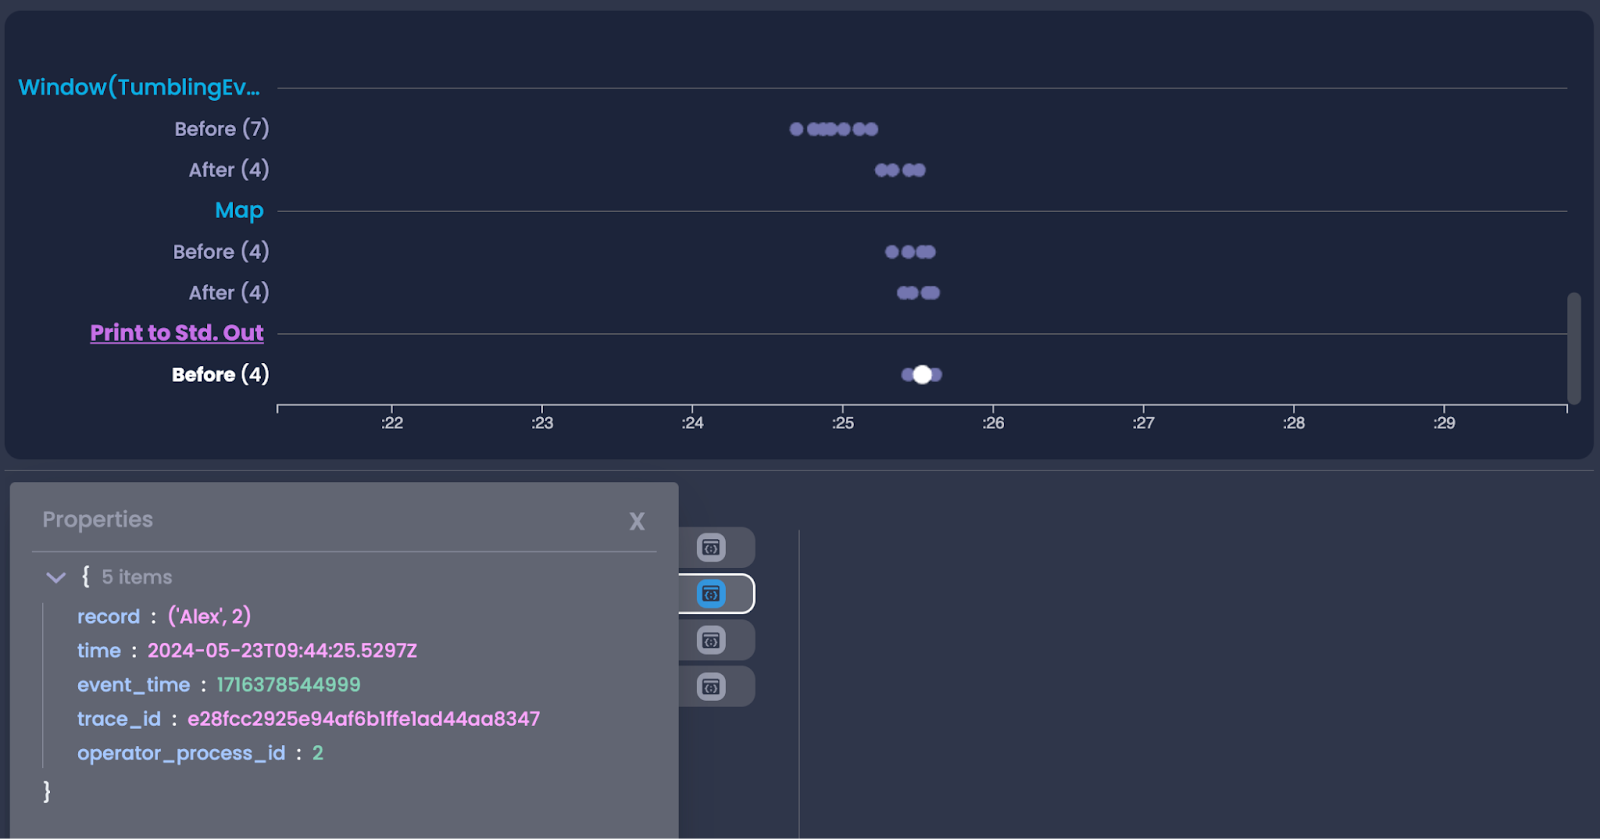
Along with seeing an overview of the pipeline, we can also do the same digging into individual records and seeing their content and the metadata about the record! Here we can see the aggregated message metric, in this 5 second window Alex sent 2 messages, which we can confirm by looking at the source data.
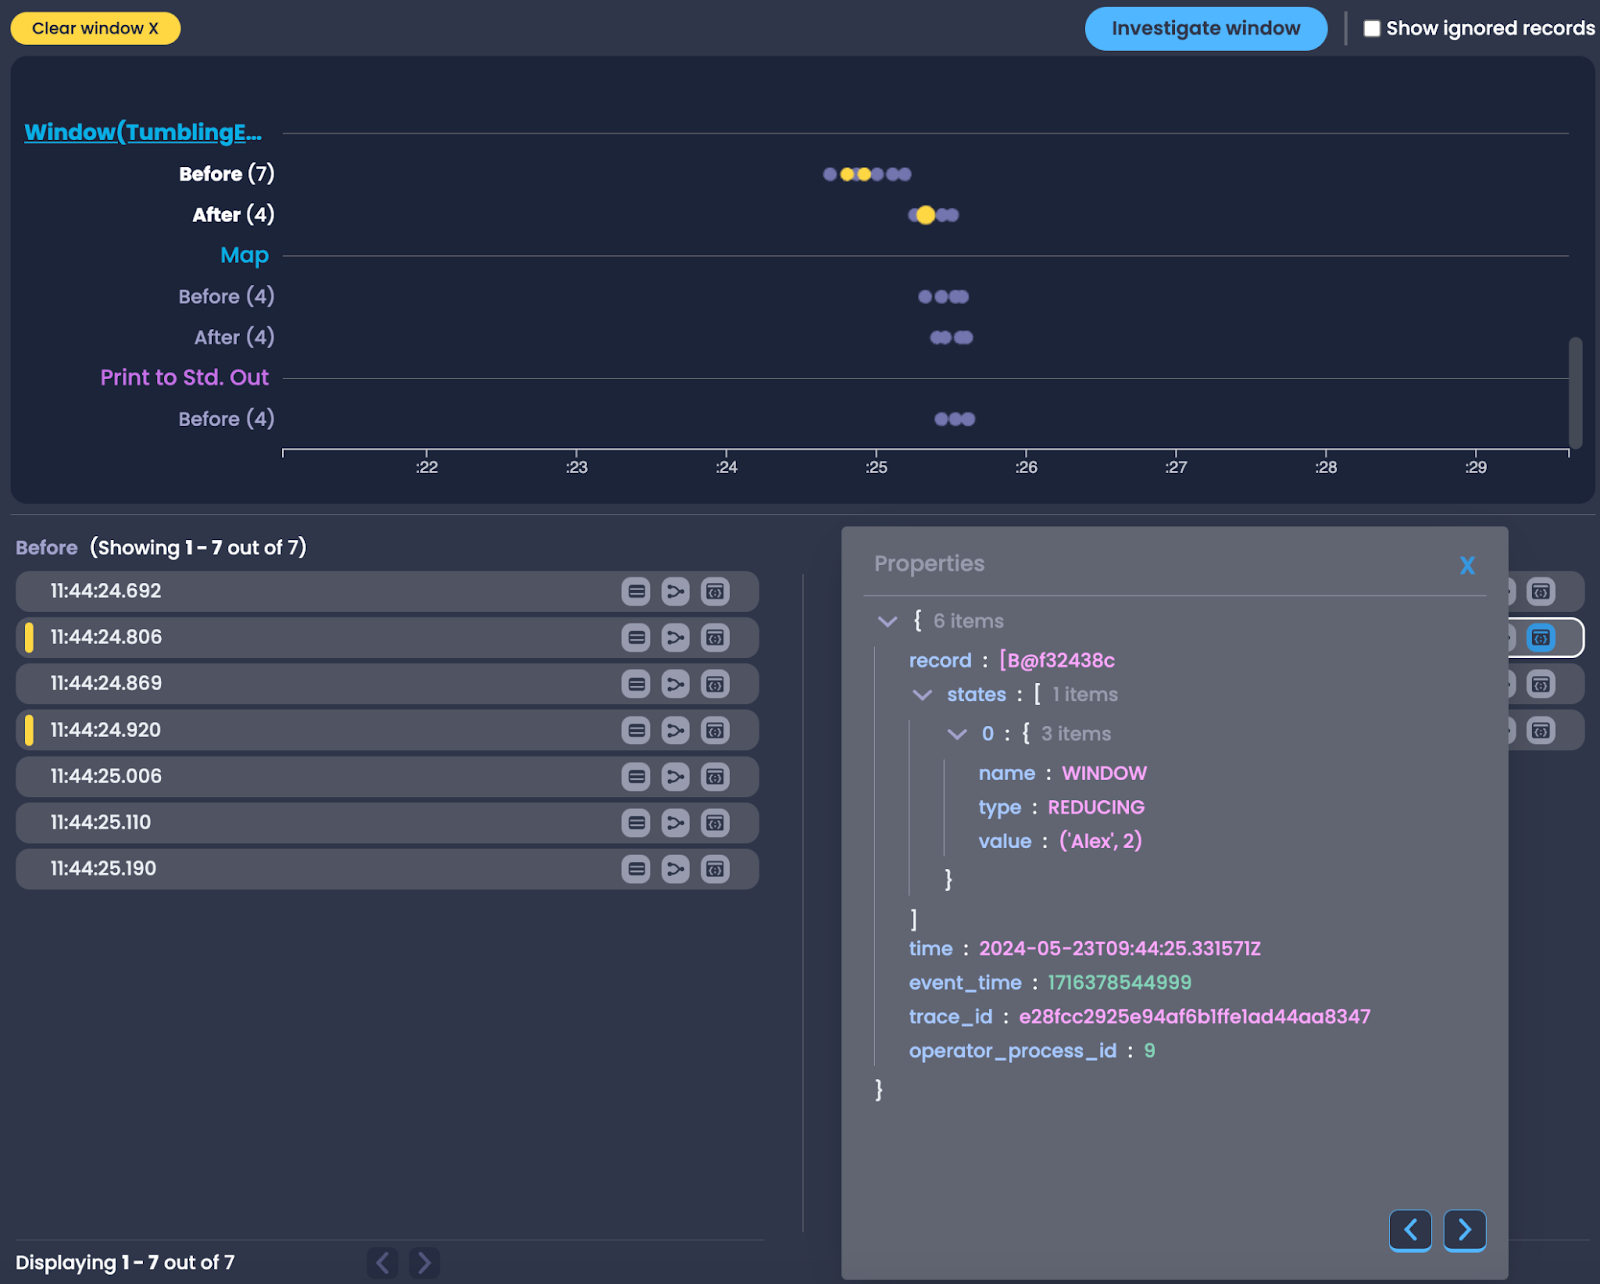
You can also do the same Window Investigation that we’re used to with Java API pipelines exactly the same and view the state held in the window operator.
Today we’ve written a simple PyFlink pipeline to give you a little insight into just how easy it is to get started by leveraging the power of Flink alongside the ease of use of Python. The power of PyFlink comes from its lower barrier of entry to people who may not be familiar or comfortable with Java and its ability to bring in other Python libraries into processing data with Flink.
We hope that with today’s introduction you’ll be empowered to go out and discover the use cases for you and your team to harness the power of PyFlink, and until next time! 👋🏻
Last week at Flink Forward, together with Colten Pilgreen, I had the pleasure of presenting Datorios’ data lineage
Introduction At Datorios, we are always pushing boundaries to empower real-time data processing at scale. Today, we are


Apache Flink is a powerful, open-source stream processing framework for real-time and batch data processing. Flink-as-a-Service operations provide
Fill out the short form below