December 12, 2024
First We Take Texas, Then We Take Berlin: Real-Time Data Trends 2024
In 2024, two key events in the world of real-time data streaming took center stage. These events illustrated


Reverse-engineer and extract missing data traces to enrich existing metrics, enabling effective real-time observability.
Companies can now easily correlate data, trace logs, and metrics when they matter most.
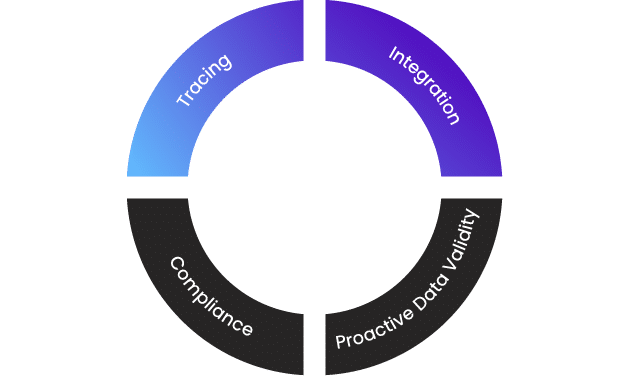
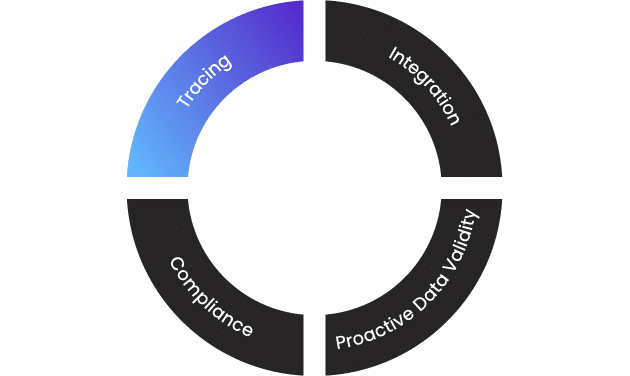
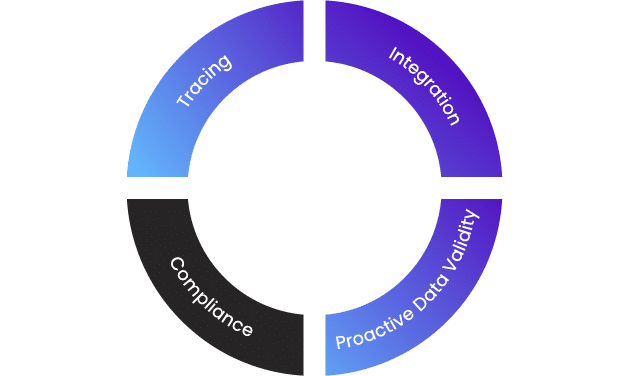
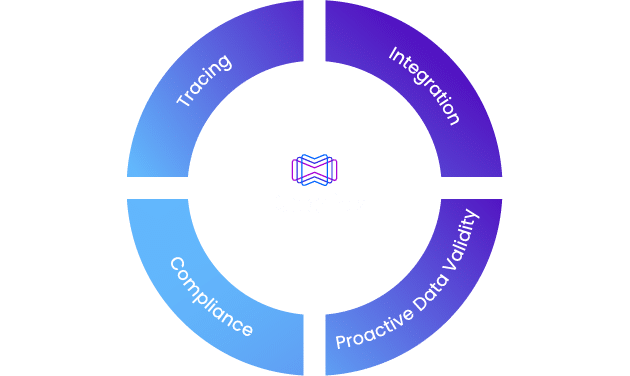
Datorios’ real-time observability cycle begins at the development stage and extends through production and beyond.
Datorios’ data lineage capabilities enable companies to dramatically reduce audit and compliance times, allowing them to focus their resources on innovation.
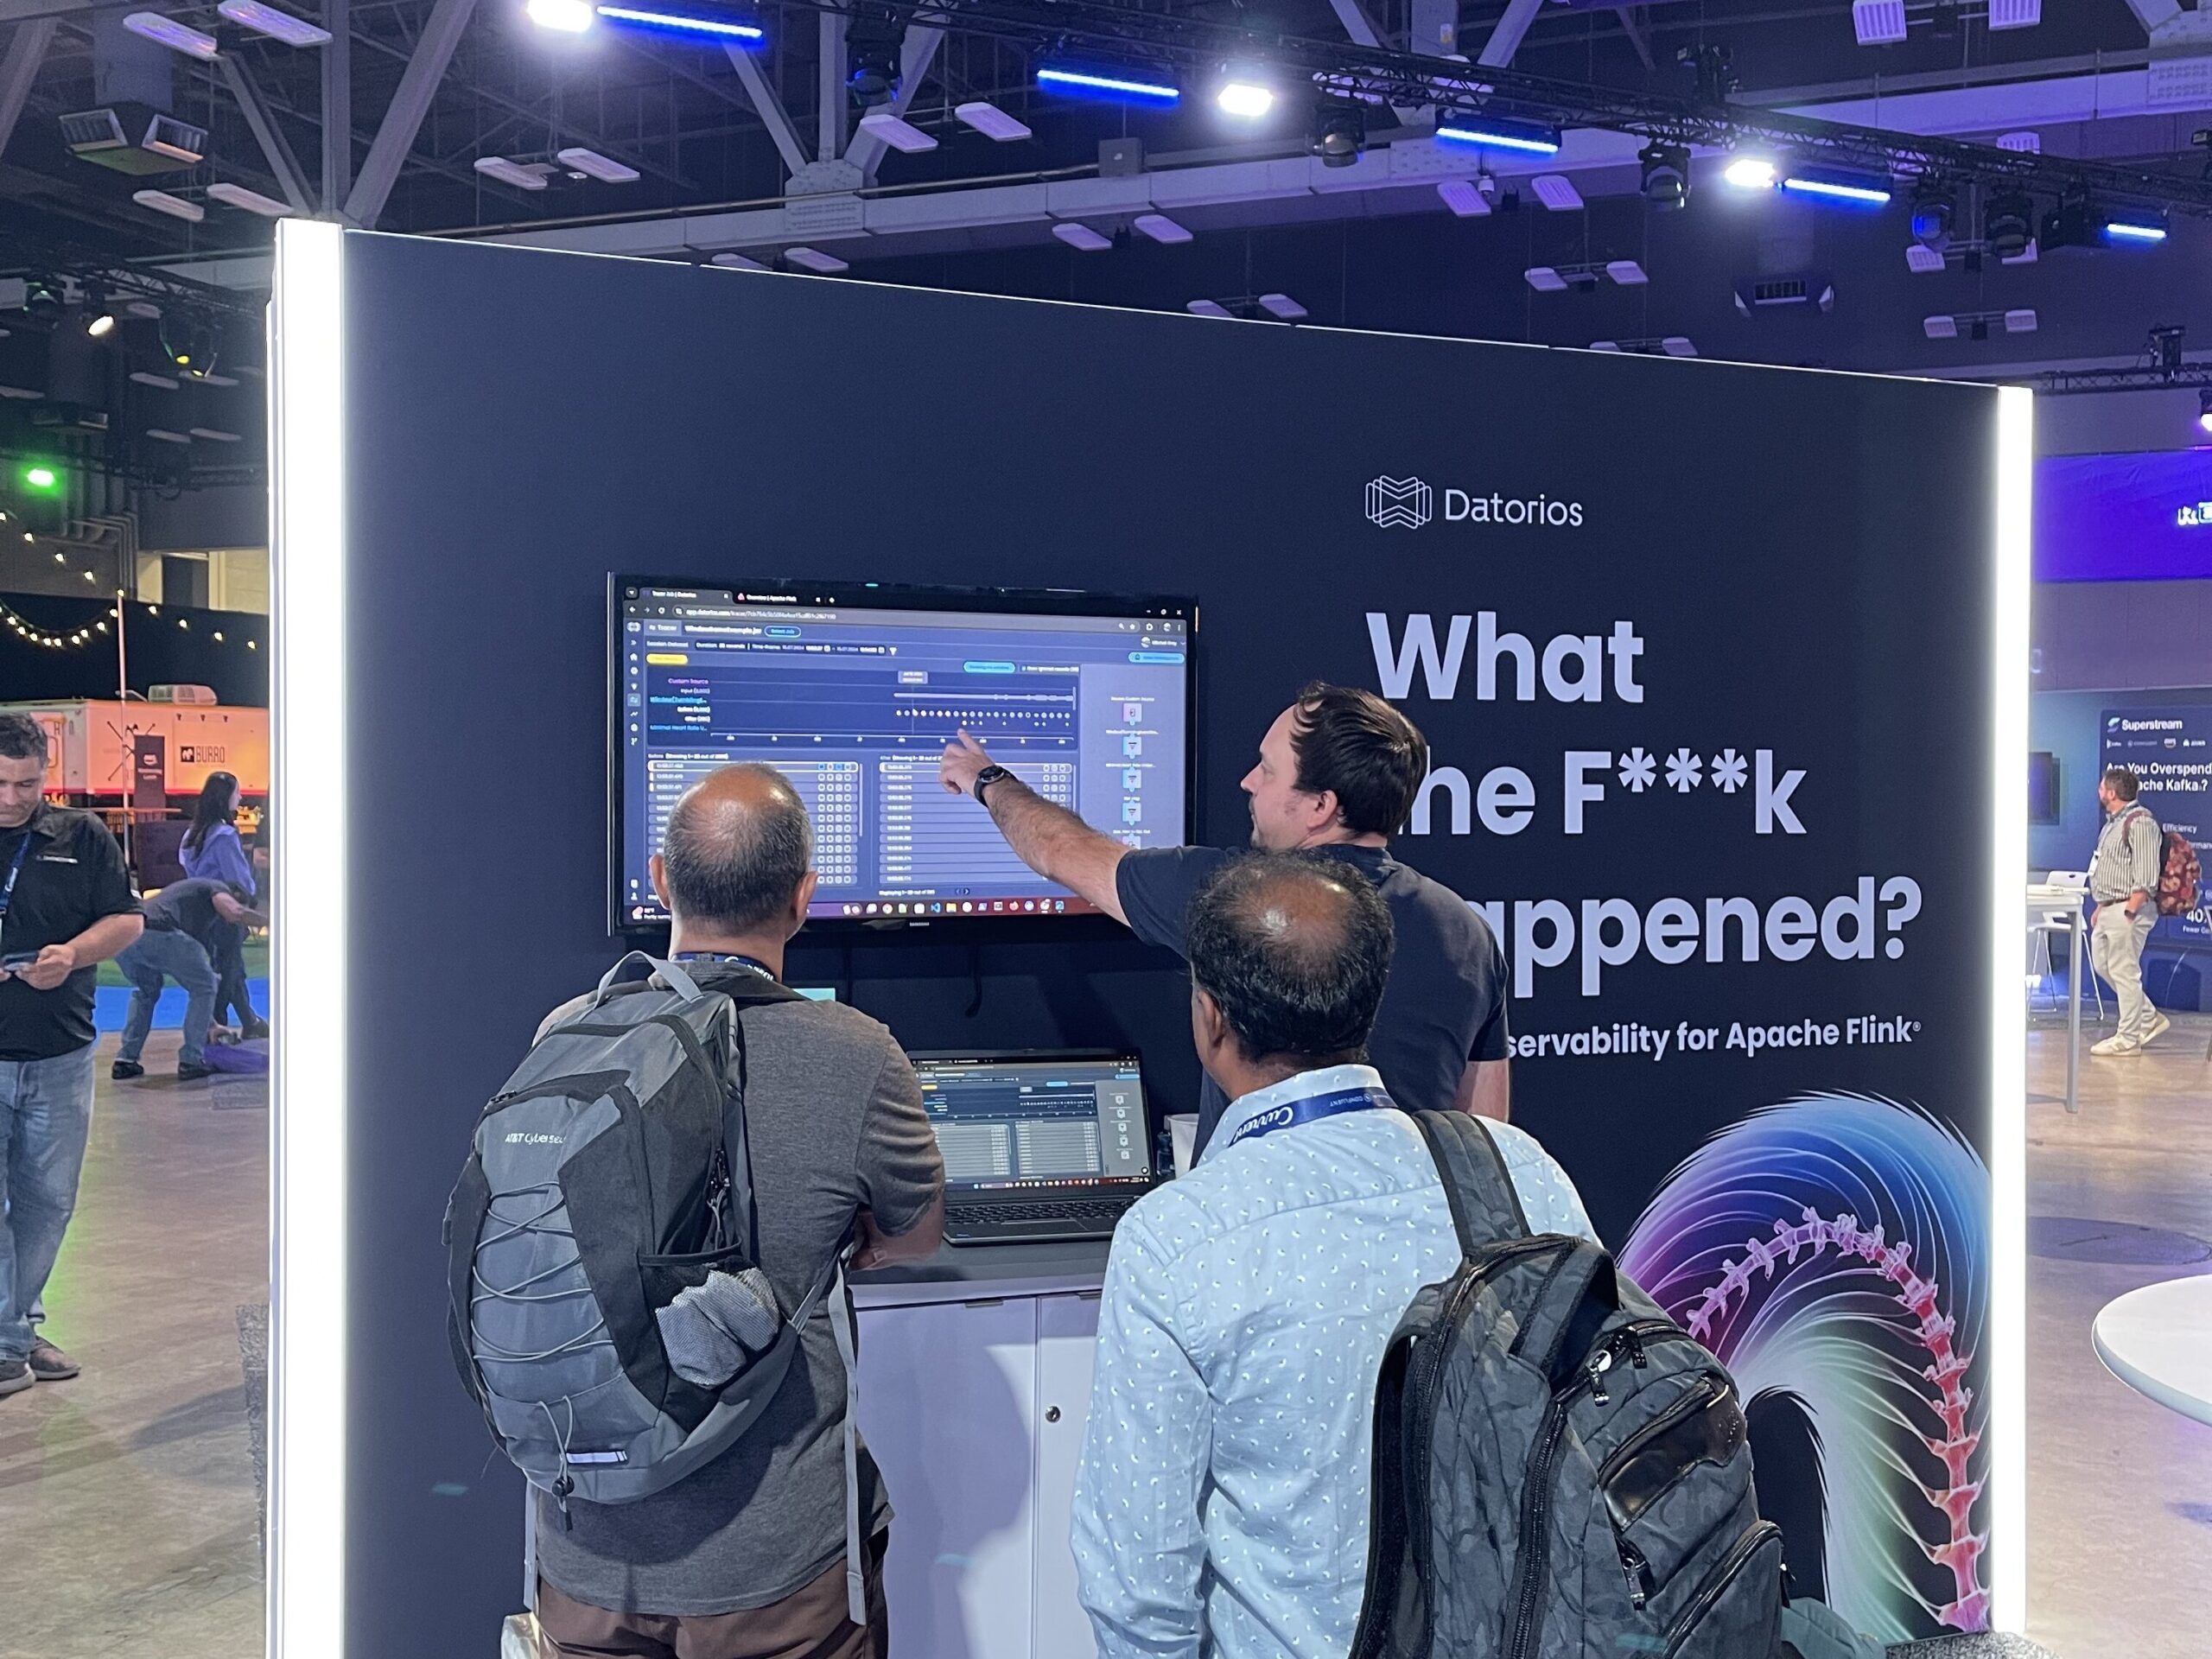
Solving the real-time observability gap for real-time applications.


In 2024, two key events in the world of real-time data streaming took center stage. These events illustrated

“In a world powered by AI, trust in data is nonnegotiable.”

“70% of organizations that successfully applied observability will achieve shorter latency for decision-making.”

“Investment in data observability has enabled the company to proactively monitor and improve data quality.”

“Observability can play a critical role in improving the overall efficiency, reliability, and security of AI-powered data center networks.”


Fill out the short form below