October 30, 2024
The Data Lineage Apache Flink Really Needs: Debugging Policy Violations
Last week at Flink Forward, together with Colten Pilgreen, I had the pleasure of presenting Datorios’ data lineage


In my previous article, we dove head first together into the hows, whats, and whys of Data Lineage in Flink. So, if you haven’t read that article, I’d give it a read to understand the basics and challenges that come along with lineage because we’re back today with a new lineage tool for Apache Flink that is likely to significantly simplify your data lineage journey with Flink.
If you haven’t heard it all ready, Datorios’ latest update includes a necessary addition to any Flink developer toolbox, the Lineage Analyzer. It allows us to attach to one of our pipelines and see the records as they flow through the operators, allowing us to click on any sink and find the journey for any given record. How it was transformed, which other operators it touched, and eventually see which source(s) fed us the original record(s).
I touched previously on how we could imagine our lineage graph, and that we were actually building the map of our data lineage by connecting our operators together. The Job Graph is a DAG (Directed Acyclic Graph), which is the perfect choice for us visualizing lineage. Datorios also thought so as well, and created a special view on our Job Graph to show us the lineage information that we really want to see.
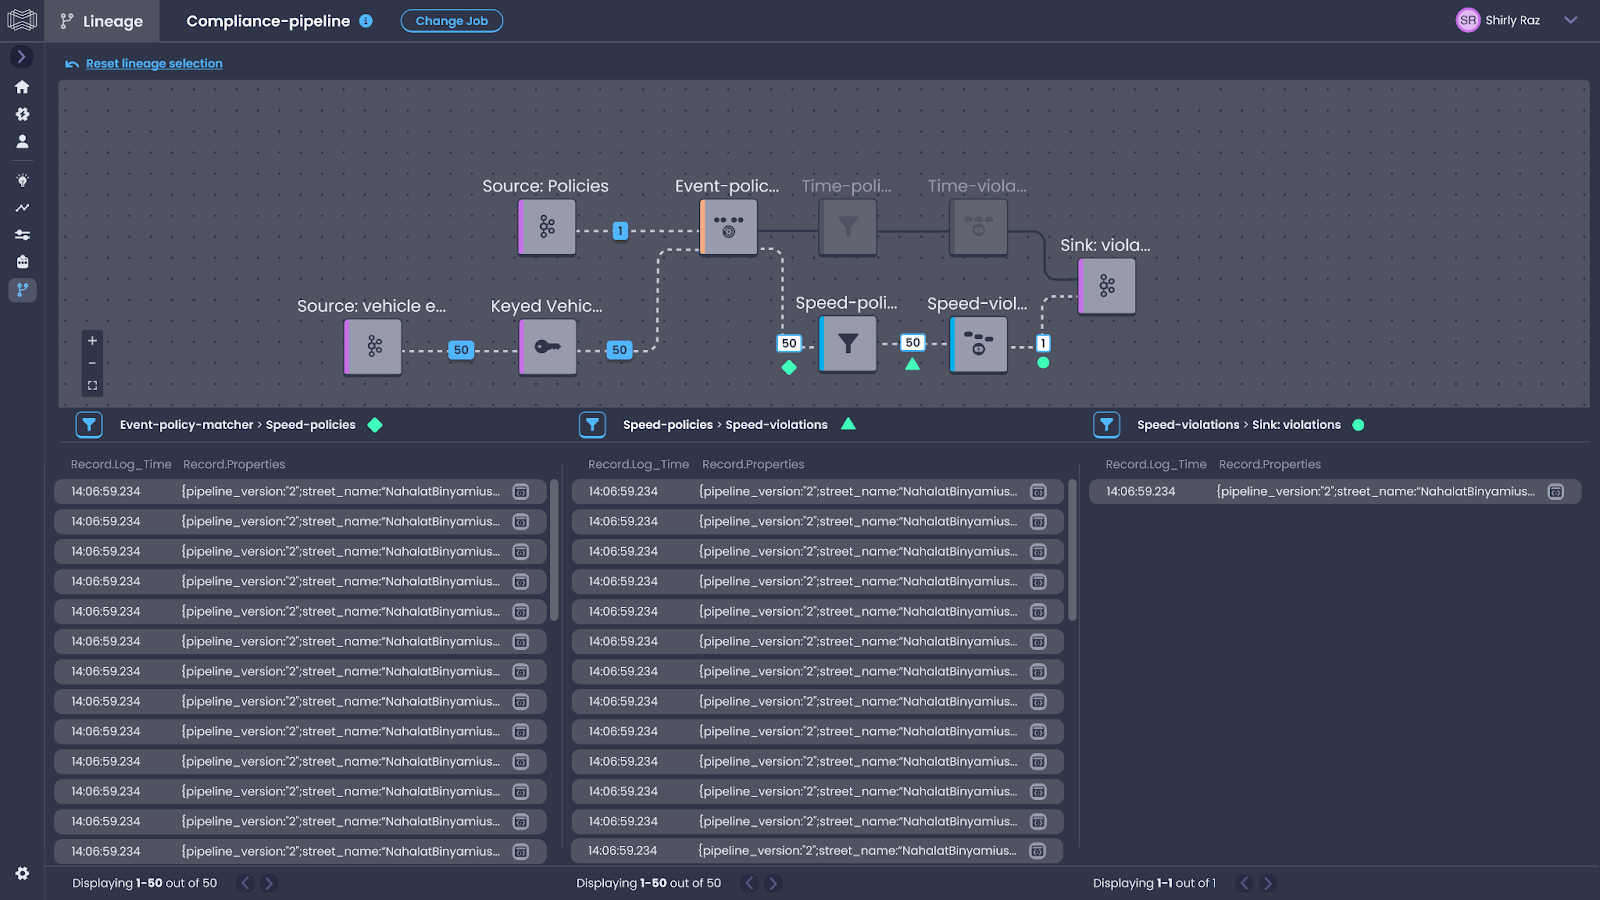
Each node in the Job Graph represents an operator, and the edges between them depict the flow of data. This graph not only shows how operators are connected but also offers insights into how data is partitioned, shuffled, and distributed across the pipeline. By analyzing this graph, we can click into any record on a sink, and then follow it up through the operators to see which records came together to form the output record.
By clicking on the number on the edges between the operators, we’re greeted with a view of the records on the bottom sections, each section is denoted with a symbol tying back to which operator that you’re viewing records for. The icons located in the middle of operators depict which type of operator it is, like a Kafka source/sink, KeyBy, ProcessFunction, Filter, or Window.
I went over a few of the practical applications in my previous article, but using this tool can significantly reduce the amount of time spent on your investigations. The following applications are where I see the most value when it comes to the new lineage tool, but the opportunities are endless.
When something goes wrong in a Flink job, whether it’s data corruption, unexpected outputs, or a performance bottleneck, knowing the lineage of your data can make debugging much simpler. By tracing the data flow through the Job Graph, you can pinpoint where things started to go awry and address the issue more efficiently. The nice part about this new lineage tool is that you can click into each record for an operator and see the accompanying state values when the record passed through the operator. This way you can tell if the potential problem isn’t just limited to lineage, but also potentially a problem with the way you’re storing (or not storing) state values.
For many of us, we are using Flink as part of our mission critical pipelines that are used for billing or accounting data. Ensuring that our revenue is correct and traceable is vital. There also may come a day when someone wants to know more information about the related records that your pipelines are producing. Perhaps a Business Analyst or Auditor thinks that billing metrics seem “off”, beforehand you’d need to pull down all of the related data and re-run your pipeline to ensure what was produced was correct, but now you can simply point them to the lineage tool and let them query away. Making your life and their life much much easier.
By gaining insight into your lineage, it can actually help you optimize your pipelines. If you’re able to understand the flow of data, then you can start to look more closely at which operators are taking more time to process than others. Datorios’ Lineage & Tracer tools are able to let you know if you have a specific key in an operator that is receiving vastly more data than the other keys. This forces one of your task managers to work harder than the others, you might be able to break out the operator into different stages allowing the work to be spread more evenly.
The problem with lineage as we see it today, they focus solely on the broader picture. There are other lineage tools that can integrate with your Flink pipelines like OpenLineage, Marquez, or Apache Atlas. The issue with these tools is that they only show how our pipelines connect with other pipelines. This macro view is great when you’re trying to figure out ownership, but oftentimes with Flink we’re wanting a more micro view into our data. It’s not an uncommon thing for me to hear that Flink is a “black box” from other members on my team.
The way that Datorios differs from these tools is that it allows us an x-ray view into Flink, to put it into context with the other tools, it essentially treats each individual operator as its own pipeline. In other tools we’d see “Pipeline A” connect to “Pipeline B & C”, but with Datorios it’s as simple as changing our “pipeline” with “operator”. Allowing us to see the much needed micro view into Data Lineage.
If you’ve recently started on your data lineage journey or if you’ve been in the game for a while, I highly recommend you check out the lineage tool for Apache Flink that Datorios has developed. Lineage in itself is an essential tool for ensuring the reliability, performance, and compliance of your data processing pipelines. By tracing the journey of data through various operators and understanding the transformations it undergoes, you gain powerful insights that can make your Flink pipelines more robust and efficient, and give peace of mind to yourself and the people who rely on them.
Until next time! 👋🏻
Last week at Flink Forward, together with Colten Pilgreen, I had the pleasure of presenting Datorios’ data lineage
Introduction At Datorios, we are always pushing boundaries to empower real-time data processing at scale. Today, we are


Apache Flink is a powerful, open-source stream processing framework for real-time and batch data processing. Flink-as-a-Service operations provide
Fill out the short form below