Governance, Observability, and Troubleshooting: Let’s Talk About Your Real-Time Data Blind Spot
If you’re like most organizations, you currently have real-time data processing projects built, under construction, or planned. The


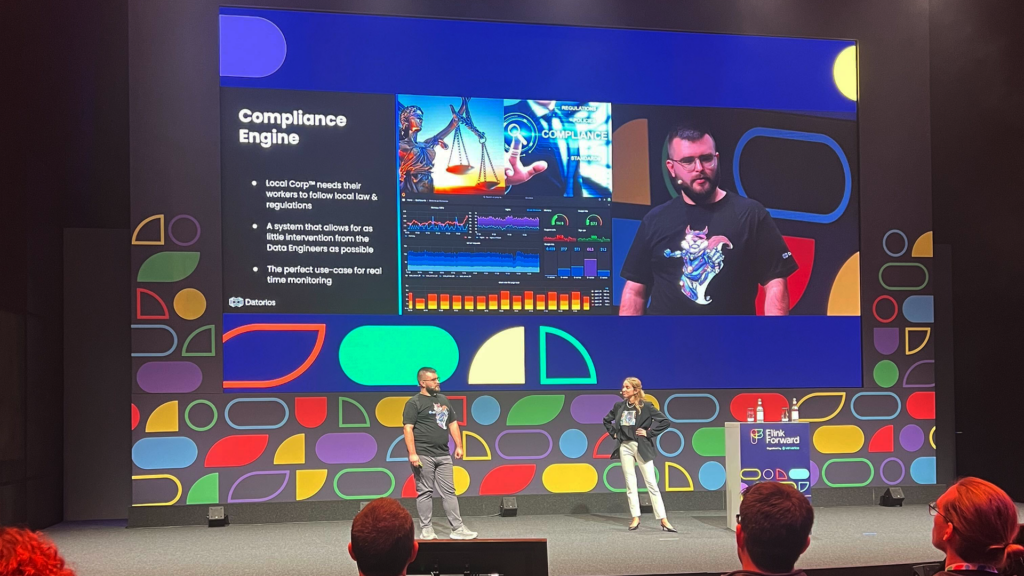
Last week at Flink Forward, together with Colten Pilgreen, I had the pleasure of presenting Datorios’ data lineage feature—a powerful tool for achieving real-time visibility into complex data flows within Apache Flink pipelines. This feature is a game-changer for anyone navigating Flink’s intricacies, particularly when it comes to tackling some of the most demanding challenges in real-time data observability and debugging.
In real-time data processing, managing complex data flows can feel like troubleshooting a massive factory where every small misstep can lead to costly issues. Pinpointing the exact cause of these errors becomes challenging, especially when thousands of “ingredients” flow through hundreds of transformations. In Apache Flink, this complexity can make tracing errors through data streams a significant challenge, which is where data lineage proves essential.
Apache Flink pipelines handle massive volumes of data at high speeds, undergoing numerous transformations. However, if an issue occurs, it can be buried beneath layers of aggregated records and operator states. Flink’s Job Graph only offers a high-level view of the pipeline without granular insights into individual records as they pass through transformations. This limitation often leads to prolonged debugging efforts, as teams lack the detailed visibility needed to isolate and resolve root issues efficiently. Here, data lineage becomes a critical component for effective troubleshooting.
In the traditional sense, Data Lineage is the ability to know which datasets are being used, how they’re transformed, who is consuming them, and where they even end up. So why should data lineage for Apache Flink be any different? Real-Time Data Lineage provides a way to trace a record’s life cycle across each operator it touches in the pipeline. It allows teams to identify where data originates, what changes it experiences, and where it ultimately ends up. Simply put, lineage is now an investigative tool that supports faster root-cause analysis by offering a clear view of data flows at each processing step.
By enabling visibility into every transformation, lineage empowers teams to address pipeline issues with confidence, reducing the time and effort required for troubleshooting.
One recent use case at Datorios illustrates the transformative role lineage plays in operational troubleshooting. In this scenario, a large corporation managing a fleet of vehicles needed to ensure compliance with traffic and environmental regulations. Their objective was to monitor and report violations such as speeding or idling in restricted zones, but implementing this in Flink revealed unexpected challenges.
The overall structure of the pipeline is fairly straightforward, there are two different source streams, which are co-processed together, and then there are session windows at the end of the pipeline to compute if a violation has occurred, after the violations are computed they are sinked to another Kafka topic.
This is what takes our Vehicle Events and then broadcasts the policies over them. Active Policies are kept in a MapState and then when each new Vehicle Event is received, the profile and zones attached to the policies are checked to see if a Vehicle Event matches it. If it does, then it is sent downstream to our session windows. It also keeps track of all of the policies a vehicle is matched to, so when a Vehicle no longer matches to the policy, the accompanying session window can be closed.
The final part of our pipeline’s story is the Session Windows. There are two different types of windows that mirror the types of Policies available, Speed & Time. Speed Session Windows are used to determine if a Vehicle is driving too fast (or too slow) for what the Policy allows. Time Session Windows are used to determine if a Vehicle is idling for too long based on what the Policy allows.
After the pipeline processed its data, the compliance reports flagged a field worker for multiple infractions despite the field worker’s insistence on adhering to regulations. Further analysis revealed data inconsistencies, with improbable speeds topping out at 36,000 km/h. Clearly, a processing issue was affecting the validity of compliance reporting.
The root cause of this situation was due to a poor system design. The way the Vehicle Telemetry is reported to the API is by having the Field Workers select the vehicle they are taking out for the day. The issue is that the Field Worker’s App allows for two different drivers to select the same vehicle, an oversight in the design of the App & it’s backend API. This meant that the “same” vehicle could be in vastly different places, this was throwing off the calculation of the vehicle’s speed & idle status.
When trying to get to the bottom of this issue, the team had to re-process the Vehicle Events again to see if they could figure out where the problem was arising. The issue here is that once the Field Worker had brought up his concerns about his compliance report, it had already passed the 7-day retention policy on our Source Kafka topics.
Since Vehicle Events are a computed event, they were not stored anywhere other than Kafka to save on storage costs. The idea was that you could always derive the Vehicle Events again if ever needed. They had to pull the source Telemetry events from Iceberg and reprocess them into Vehicle Events. While that reprocessing occurred, they also had to pull all of the policies from MySQL. Once all of the data was available, they populated new Kafka topics specifically for this incident investigation.
Great, the data is now available. The next step is reprocessing them into violations. Thankfully this part is straightforward due to Flink’s ability to run in Batch mode against a bounded stream of data. Once the violations were reprocessed they compared the new violations to the original violations. However, the violations were exactly the same. This is good news in that they didn’t lose any data as part of the re-processing of Telemetry events into Vehicle Events, but it’s bad news in that it doesn’t get them any closer to an answer.
From here, this is when they decided to look at those re-processing Vehicle Events in Kafka. They used a tool called Kcat (as called Kafkacat) to pull the events down and look through them. This is when they noticed the source events had those ridiculous speeds attributed to them. This meant the problem was further upstream in the Telemetry API, good news for the Data Team and they were able to punt the investigation back over to them.

Without data lineage, we saw that resolving this issue required labor-intensive, manual investigation—combing through Kafka topics, reprocessing telemetry data into vehicle events, and replaying Kafka streams. However, by utilizing Datorios, you are conducting the investigation on the exact records that were present in the pipeline when it originally ran. This removes the need for collecting the data, reprocessing, and bouncing in between different tools. This simplification of the debugging process isn’t only a time saver, it helps avoid mistakes that might occur during all these manual steps.
With Datorios’ lineage feature, the debugging process was streamlined through three key steps:
Data lineage in Apache Flink is not just beneficial for compliance or debugging; it provides transparency that builds trust and ensures operational reliability. Real-time errors can accumulate quickly, leading to costly impacts on decisions and operations. By enabling transparent tracking of data flows, lineage empowers teams to troubleshoot faster, mitigate risks proactively, and avoid the costly ramifications of undetected errors.
In Datorios, data lineage is a foundational feature designed to deliver exactly this level of insight. For teams working with Apache Flink or other real-time data systems, lineage might be the essential tool to demystify and optimize data flows across their pipelines.

If you’re like most organizations, you currently have real-time data processing projects built, under construction, or planned. The

Introduction At Datorios, we are always pushing boundaries to empower real-time data processing at scale. Today, we are

Apache Flink is a powerful, open-source stream processing framework for real-time and batch data processing. Flink-as-a-Service operations provide
Fill out the short form below